What are Web Vitals? They are an assessment tool from Google that helps you give the best User Experience to the audience that uses Google to search the Web. The goal is to help users find sites that are easy to read and browse fast.
They consist of several parameters that Google considers crucial for a good user experience on a given page.
Web Vitals take into account many factors (like page loading speed, optimal image display, and layout…) to determine if a page is easy or not to browse.
Thus, it’s essential to know how your site compares to the rest of the web.
How can you improve your website in terms of usability? What does the Web Vitals score tell you about your website?
You can find out below, by checking your Web Vitals score here: https://www.google.com/webmasters/tools/home?hl=en#siteSearches
They will help you understand how to improve your website’s usability and readability.
But what do all those acronyms mean? The first three are the Core Web Vitals, the most important.
Core Web Vitals are a ranking factor
Core Web Vitals are:
LCP – Largest Contentful Paint
It’s the time required to render the largest visible page element during loading. This metric assumes the biggest object to be the main content; for this reason, huge header images, pop-up windows, banner ads etc. could penalize your efforts to rank higher. Remember that only what appears on the opening viewport (“above the fold”) is taken into account. More than 4 seconds is slow.
FID – First Input Delay
It’s the time between a user interaction with the page and the browser’s response. The less (quite obviously) the better, 100 milliseconds being a threshold for a good user experience.
CLS – Cumulative Layout Shift
It quantifies unexpected layout changes and visible elements shifting during the visit. Those shiftings happen due to resizing, and are quite annoying.
Nevertheless, Google tells us that a page should be ready in less than 1 second.
These three are the most important parameters, but there are also others that you really should know about:
TTFB – Time To First Byte
TTFB is a metric that measures the time between the request for a resource and when the first byte of a response begins to arrive. It helps identify when a web server is too slow (ideally, TTFB shouldn’t be > 300 ms) to respond to requests or not. In the case of navigation requests—that is, requests for an HTML document—it precedes every other meaningful loading performance metric.
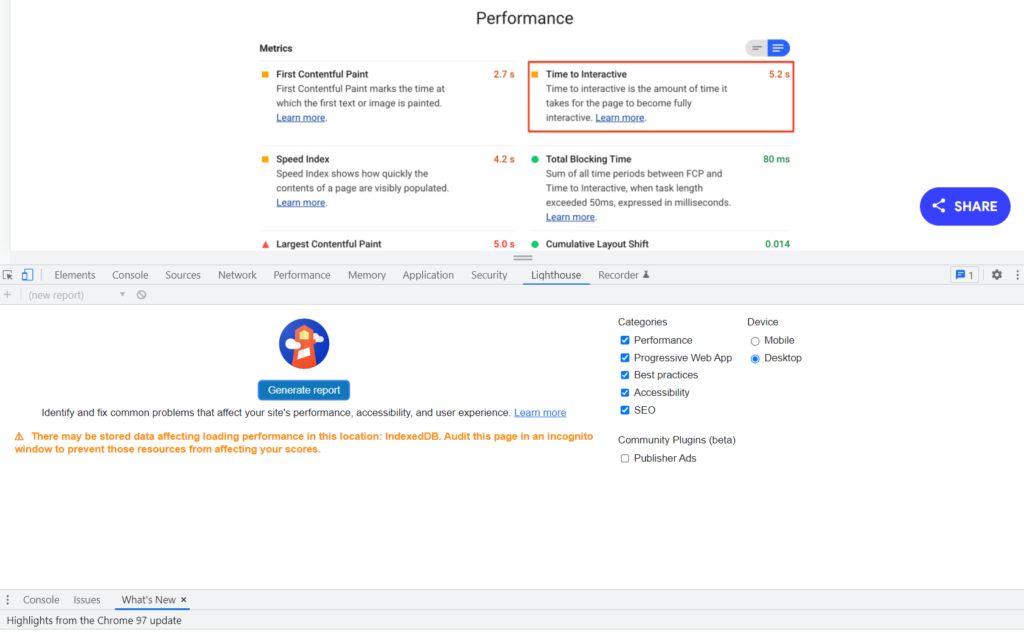
FCP – First Contentful Paint
Measures the time starting from when the page starts to load to when any content element is rendered on the screen. A fast FCP means that users see that some content elements are starting to show on the screen, and this is somewhat reassuring that there’s just a little time to wait. A good value for First Contentful Paint should not exceed 1.8 seconds.
Speed Index
It’s an index of how fast your page loads and also this one is tracked in the Performance section of the Lighthouse report.
If you have a page that loads in 300 ms, then you’re not doing anything wrong. More than 6/400 ms is a bit long, especially if you have (usually annoying) pop-up windows or big images.
TBT – Total Blocking Time
It sums all the time periods over 50 ms of every task between FCP and TTI. It’s expressed in milliseconds and its weight is a 30% of the Lighthouse score. It should be less than 300 ms.
TTI – Time To Interactive
This represents the time a page needs to become fully interactive after it has become visible.
Fully interactive means that:
- the page is perceived as fast-loading (this is measured by the FCP metric);
- most event handlers start working and can be seen by users;
- within 50 ms, the page starts responding to interaction, as Google states here.
How to check Web Vitals fast
The easiest way to check if there are performance issues on your website is to perform a basic audit: check the Google Search Console reports and evaluate the values for each one of the above metrics. If you haven’t Google Search Console installed, start checking Lighthouse: you can reach it by right-clicking on the page you want to assess, then (Chrome) choose “Lighthouse” on the top menu of the frame that opens up.